Creating a Custom Policy
Define custom guardrail and detection policies for DAM and data security.
Overview
Aurva ships with a comprehensive library of built-in policies for database activity monitoring and data security. However, every organization has unique security requirements. The Create New Policy workflow lets you define custom policies tailored to your environment — from blocking risky queries and masking sensitive data in query results to setting up detection alerts for suspicious activity.
Policy creation follows a guided 3-step process: selecting a policy type, configuring the policy rules, and previewing before activation. This guide walks you through each step.
Understanding Policy Types
Aurva organizes policies into two categories based on how they respond to database activity:
Guardrail Policies (Prevention)
Guardrail policies actively intervene in database operations. They sit in the data path and can block or modify query results in real time. These require DAM and Prevention mode to be enabled (via proxy-based enforcement).
1. Block Risk Queries
Prevents queries from executing on your databases. Use this to stop dangerous operations before they can cause damage.
Common Use Cases:
-
Block DDL commands (DROP, ALTER, TRUNCATE)
-
Prevent DELETE/UPDATE without WHERE clause
-
Stop queries during maintenance windows
-
Block access from unauthorized users/IPs
2. Mask Sensitive Data in Query
Allows queries to execute but masks sensitive data in results. Users get the data they need without seeing raw sensitive information.
Common Use Cases:
-
Redact PII (SSN, email, phone)
-
Mask payment card numbers
-
Protect health information (PHI)
-
Hide customer identifiers
Detection Policies (Monitoring)
3. Detect & Alert
Monitors database activity and sends notifications when suspicious patterns or policy violations occur. Queries are logged but not blocked.
Common Use Cases:
-
Alert on configuration changes
-
Notify on unusual access patterns
-
Track sensitive data exposure
-
Monitor privileged user activity
Prerequisites
-
You have an active Aurva account with Admin or Policy Manager role.
-
At least one data asset is onboarded and associated with a controller.
-
For Guardrail policies: DAM must be enabled and the controller must be running in Prevention mode with proxy-based enforcement active.
-
For Detection policies: DAM must be enabled. Prevention mode is not required.
Important — If proxy-based enforcement is not enabled, Guardrail policy types will appear greyed out with a “Proxy Not Enabled” label. Contact Aurva to set up proxy before these policy types become available.
Navigation
To access the policy creation flow, navigate to:
| Settings › Policies › Create New Policy |
|---|
Step-by-Step Instructions
Step 1: Open the Policies Page
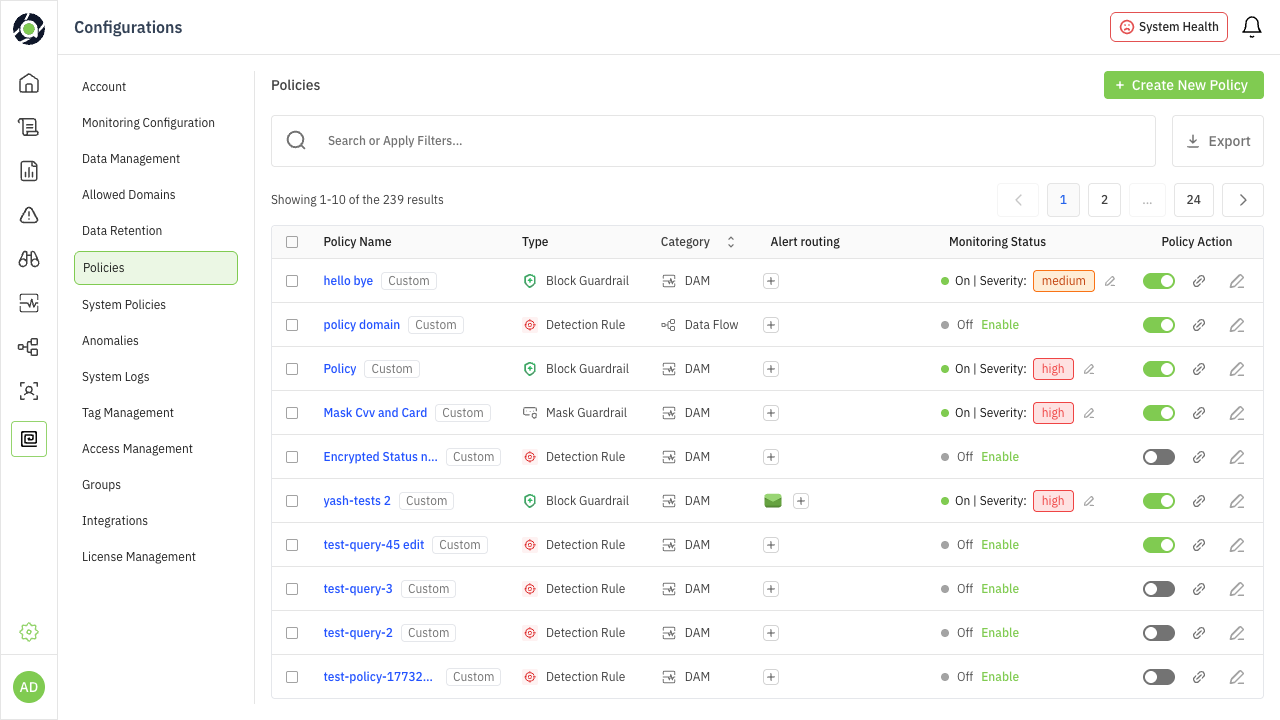
From the left sidebar, go to Settings and select Policies. This opens the Policies list view, which displays all existing policies — both system-provided and custom. Each policy shows its name, category (DAM or Data Flow), severity level, alert routing configuration, and current status (enabled/disabled).
Click the + Create New Policy button in the top-right corner to begin.
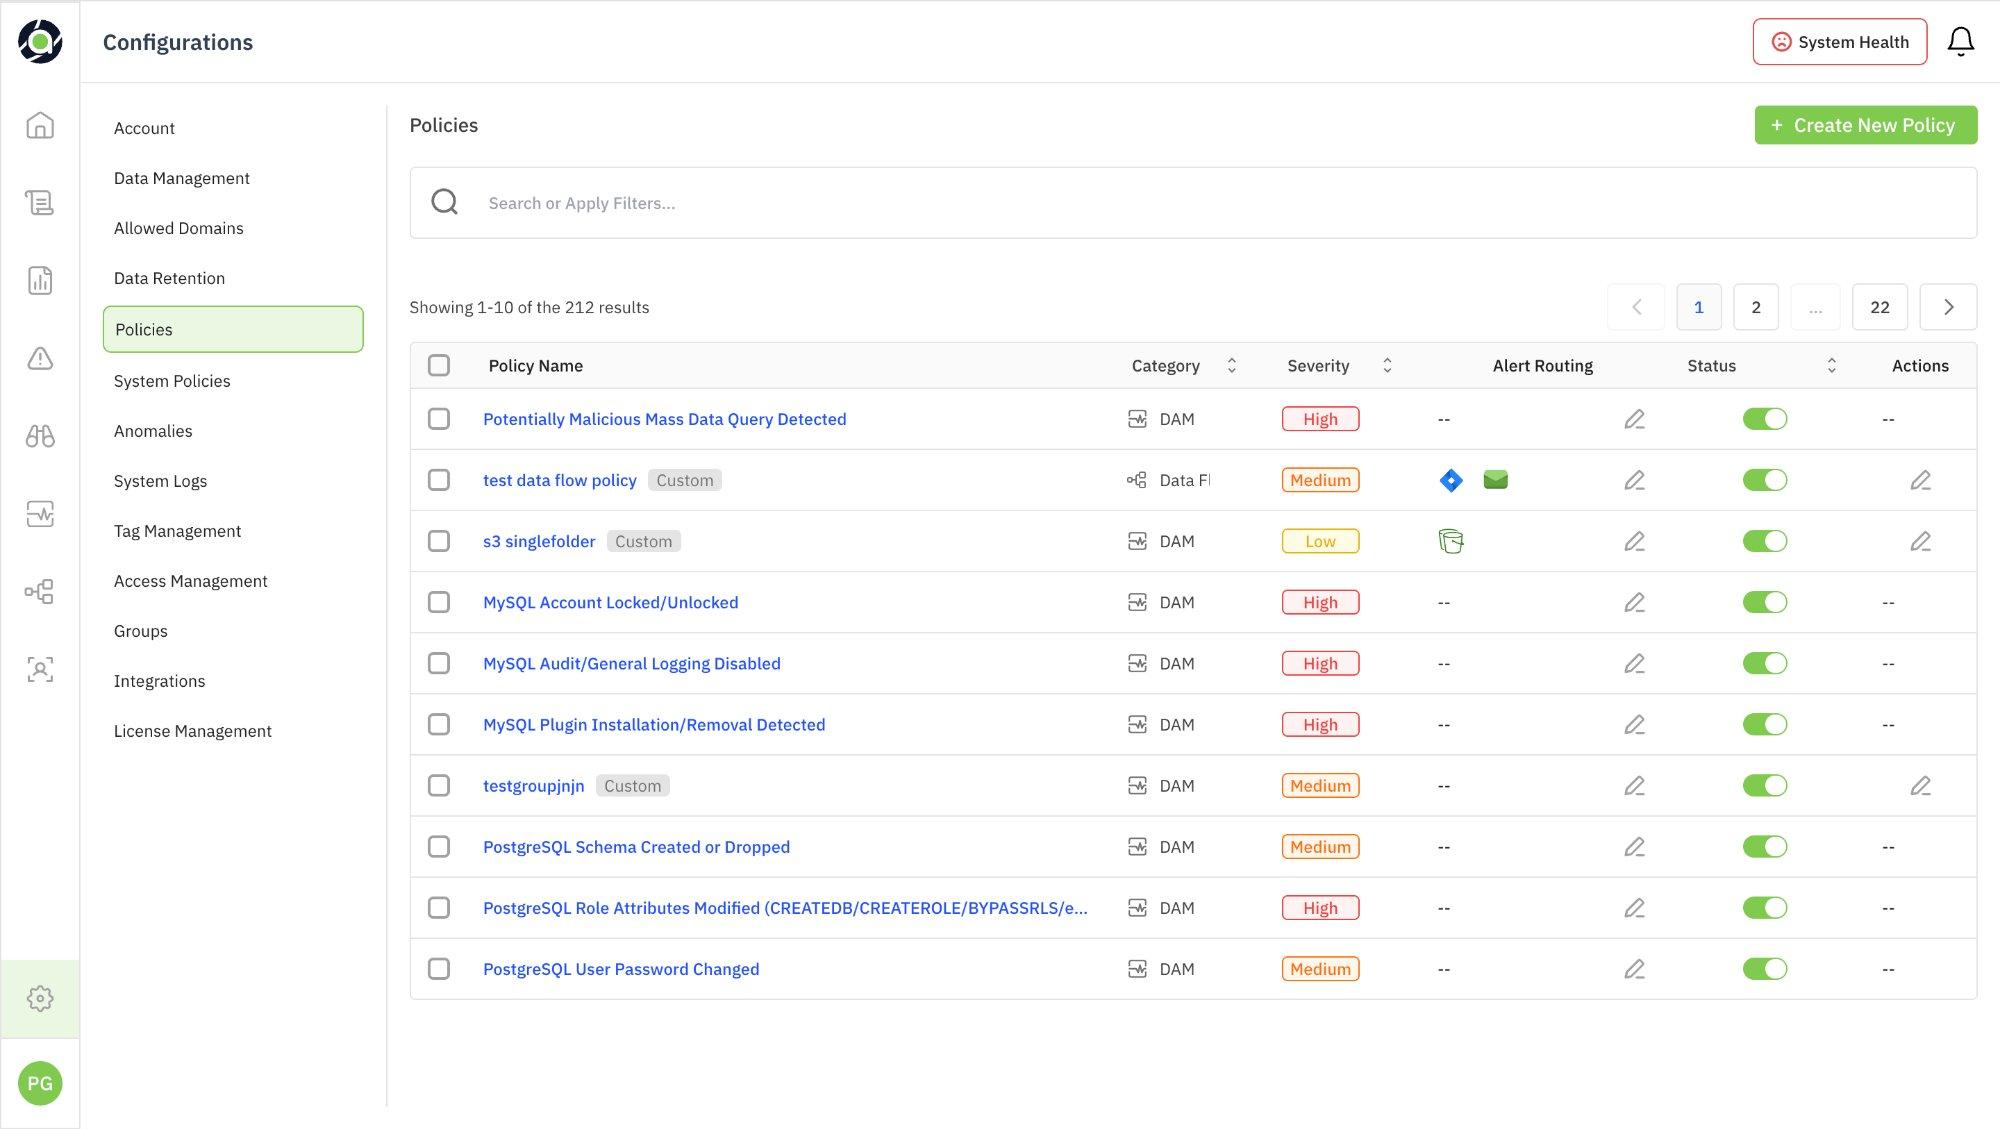
Figure 1: Policies list view with Create New Policy button
Step 2: Select a Policy Type
The Create Policy workflow opens with a 3-step guided process. The progress indicator at the top shows: Policy Type → Configure Policy → Preview.
Choose the type of policy you want to create:
| Policy Type | Category | Requires Proxy |
|---|---|---|
| Block Risk Queries | Guardrail (Prevention) | Yes |
| Mask Sensitive Data | Guardrail (Prevention) | Yes |
| Detect & Alert | Detection (Monitoring) | No |
Selecting a type reveals a description panel on the right with details and common use cases. Click Continue to proceed.
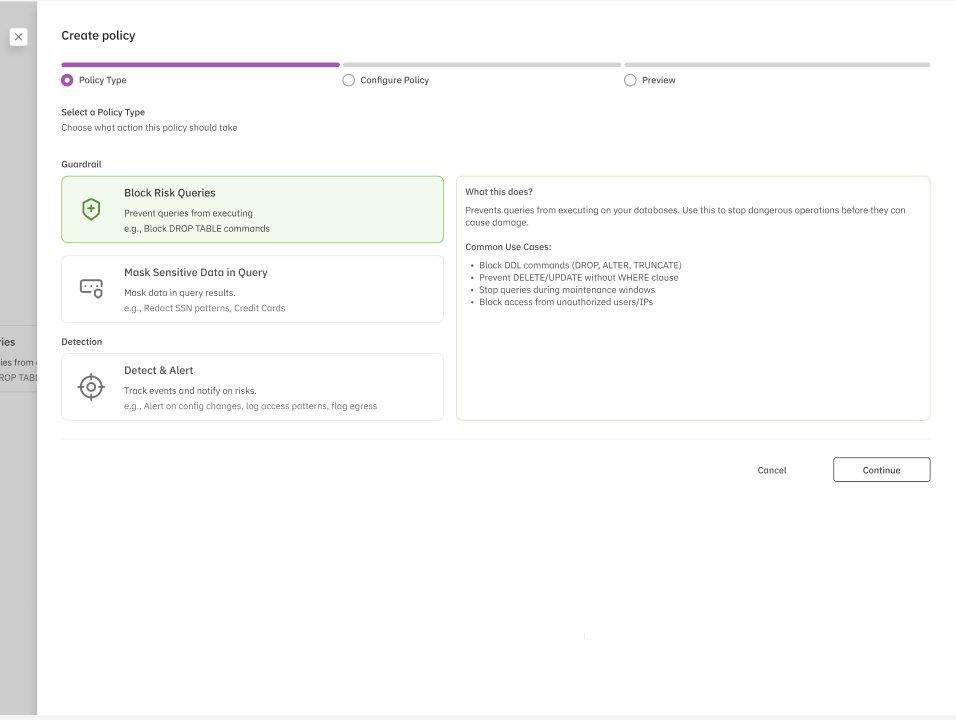
Figure 2: Policy Type selection — Block Risk Queries selected with description panel
What if Proxy is Not Enabled?
If proxy-based enforcement is not configured, the two Guardrail types will be greyed out with a “Proxy Not Enabled” badge. The right panel shows a Contact Aurva for Proxy Setup button. Continue button is disabled for Guardrail types, but you can still proceed with Detect & Alert.
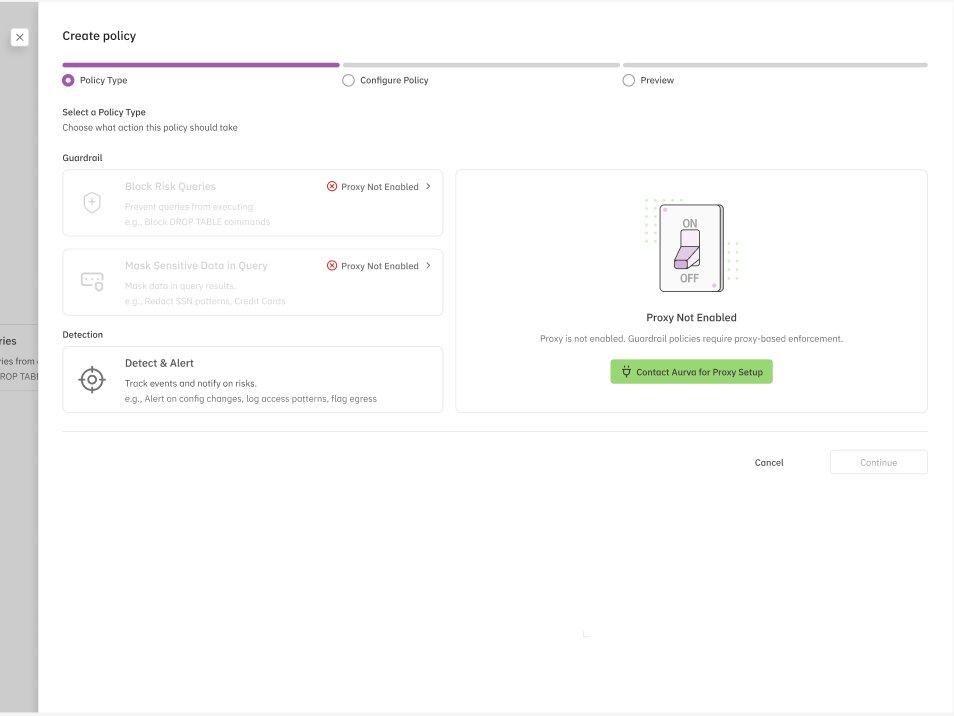
Figure 3: Guardrail policies greyed out when proxy is not enabled
Step 3: Configure the Policy
This is the most detailed step. You define the rules, schedule, alert routing, and metadata for your policy. The configuration screen is divided into several sections. The walkthrough below uses a Block Risk Queries policy as the reference example.
A. Add Conditions
Conditions define when the policy should trigger. You build conditions using a visual condition builder (with Builder and Visualize modes). Conditions are composed of condition groups connected by logical operators (AND/OR).
First, select a Policy Type from the dropdown (e.g., DSPM). Then build conditions using the available types:
| Condition Type | Description |
|---|---|
| By Actor/Source | Match based on who is executing the query — filter by user type, tags, roles, or specific identities. |
| By Query Conditions | Match based on what the query does — filter by query scope/type (e.g., DML, DDL, DCL). |
| On Data | Match based on which data is being accessed — filter by data asset name, sensitivity level, or specific tables/columns. |
Use + Add Condition to add rules within a group, and + Add Condition Group to create new groups. Groups can be connected with AND or OR logic to build complex, layered rules. Click Save to confirm each condition group.
B. Policy Schedule
Choose when the policy should be evaluated:
| Schedule Option | Behavior |
|---|---|
| Always Active | Evaluated continuously until you manually disable it. |
| Ends On… | Evaluated until a specified end date and time, then automatically disabled. |
| Recurring Schedule | Evaluated on a repeating schedule — e.g., weekdays only, specific time windows, weekends only. |
C. Test Your Conditions
Before deploying, test the policy’s impact using the Test Policy button. This performs an impact analysis against the last 24 hours of query data and shows:
-
How many queries would have been affected (e.g., “100 of 10,847 queries would have been blocked”).
-
The match rate as a percentage.
-
A qualitative assessment of whether the policy is well-targeted or too broad.
Click View Queries to review matched queries, and Refresh Results to re-run after adjusting conditions.
Tip — Use the Test Policy feature before every deployment. A match rate above 10–15% typically indicates the policy may be too broad and could disrupt normal operations. Review matched queries to confirm they align with your intent.
D. Alert Routing (Optional)
Enable Generate alerts on policy violations to activate notifications.
Policy Severity: Set the severity level (High, Medium, or Low) to prioritize alerts.
Alert Routing Through: Route alerts to integrated channels:
| Integration | Details |
|---|---|
| Jira | Create tickets automatically in your Jira project when the policy triggers. |
| Slack | Send notifications to one or more Slack channels. Select channels and sync with Aurva. |
E. Remediation (Optional)
Add remediation steps for responders when this policy triggers. This field supports free-text instructions. You can also use the Ask AI feature to generate remediation suggestions automatically.
F. Basic Details
Provide identifying information for the policy:
| Field | Description |
|---|---|
| Policy Name | A descriptive name. Use Ask AI to generate a suggested name. |
| Description | Optional explanation of what the policy detects and why it matters. Ask AI available here too. |
| Category | Select a Compliance Framework and Control Code for reporting purposes. |
Once all sections are configured, click Continue to proceed to Preview.
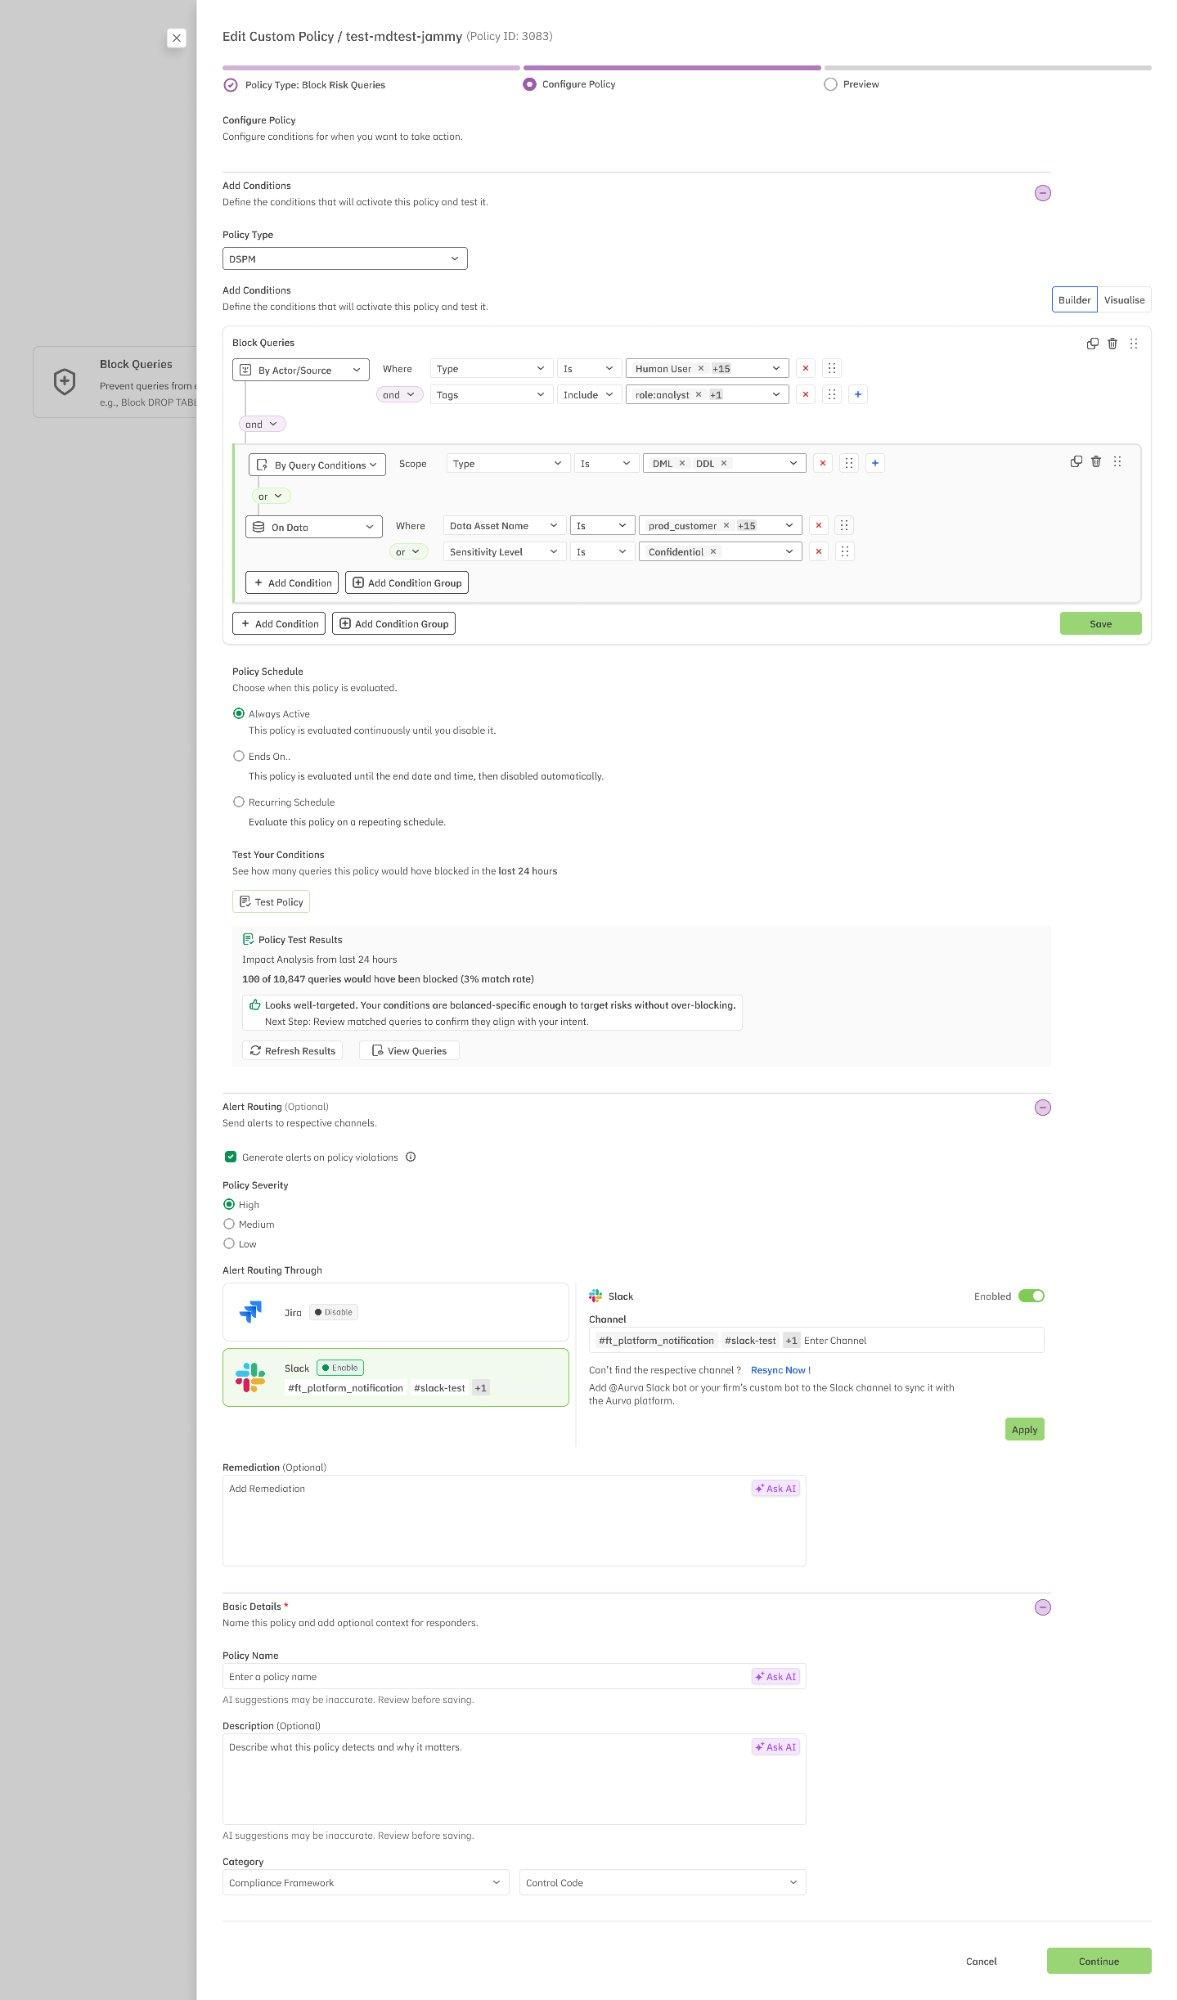
Figure 4: Configure Policy screen — conditions, schedule, test results, alert routing, and basic details
Configuration Variations by Policy Type
While the overall structure of the Configure step is consistent, there are key differences depending on which policy type you selected:
Mask Sensitive Data in Query
This policy type includes an additional configuration section: Columns to Redact. Here you specify exactly which database columns should have their values masked in query results. Define target columns so that sensitive fields (e.g., SSN, credit card numbers, email addresses) are automatically redacted while other columns return normally.
Note — The Columns to Redact section is unique to the Mask Sensitive Data policy type and does not appear for Block Risk Queries or Detect & Alert.
Detect & Alert
For Detect & Alert policies, configuration begins with an additional initial selection: Policy Type. Choose the monitoring domain before building conditions:
| Policy Type | Monitors |
|---|---|
| DSPM | Data security posture — asset classification, sensitivity levels, access permissions, and configuration risks. |
| DAM | Database activity — query patterns, user sessions, privilege usage, and operational events. |
| Data Flow Monitoring | Data movement — egress patterns, cross-environment transfers, and data pipeline activity. |
| Data Privacy | Privacy compliance — PII access, consent management, data subject requests, and regulatory adherence. |
The condition builder dynamically adapts based on your selection — each policy type surfaces different condition types, operators, and value options relevant to that monitoring domain.
Tip — If you’re unsure which Detect & Alert policy type to choose, start with DAM for monitoring query-level activity, or DSPM for monitoring security posture and data classification risks.
Step 4: Preview and Deploy
The final step presents a complete summary of your policy before deployment. The progress bar shows all three steps completed. Every configuration element is displayed in a read-only format for verification.
The preview includes:
| Section | What’s Shown |
|---|---|
| Policy Type | The selected type (e.g., Block Risk Queries). An Edit link lets you go back and change it. |
| When to Trigger | A human-readable summary of all conditions — condition logic, actor/source filters, query conditions, and data filters. A Copy button is available. |
| Policy Schedule | Complete schedule configuration — always active, end date, or recurring schedules with day and time windows. |
| Alert Routing | Whether alerts are enabled, configured integrations (Jira, Slack), and their current status. |
| Remediation | Remediation instructions for responders, if configured. |
| Basic Details | Policy name, description, and compliance tags (e.g., Payment Security Guidelines, RBI Infosec Framework, SEBI). |
Each section has an Edit link to go back and make changes. Once verified, the message “Your Policy is ready to deploy” confirms the policy is complete.
Click Continue to create and activate the policy, or Cancel to discard.
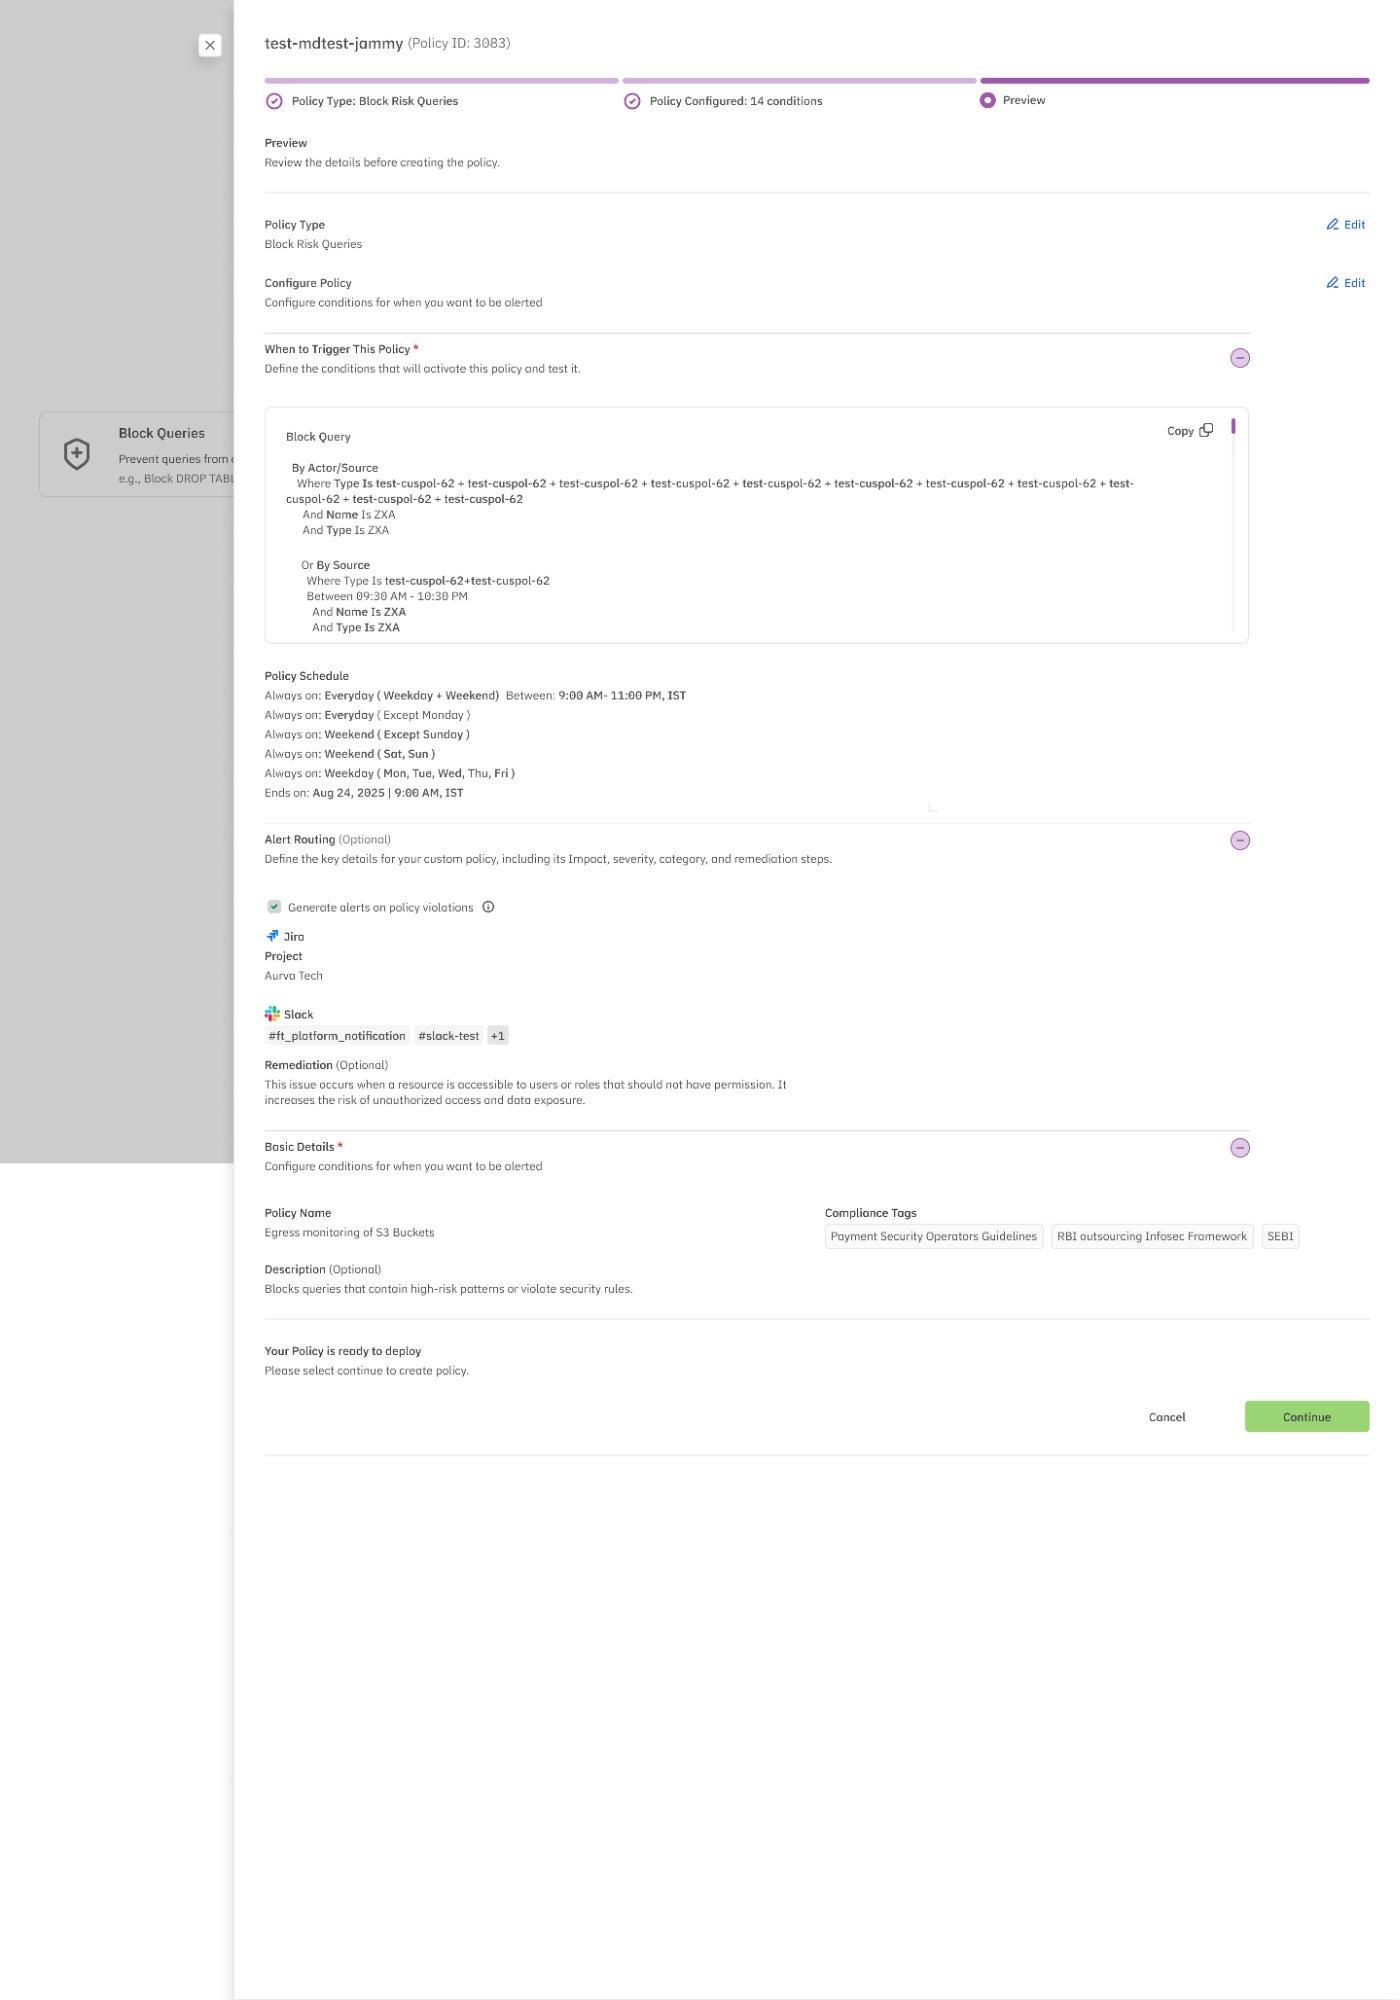
Figure 5: Preview screen — complete policy summary before deployment
Tip — After deployment, the policy appears in the Policies list with a “Custom” tag. You can enable/disable it at any time using the status toggle, or edit it via the pencil icon in the Actions column.
Quick Reference: Policy Creation Workflow
| Step | Action | Key Decision |
|---|---|---|
| 1. Policies Page | Navigate to Settings › Policies | Review existing policies |
| 2. Policy Type | Select Guardrail or Detection type | Proxy required for Guardrail |
| 3. Configure | Build conditions, set schedule, configure alerts | Test policy before deploying |
| 4. Preview | Review full summary, edit if needed | Confirm and deploy |