Monitoring Configuration
Manage Database Activity Monitoring, storage policies, and Prevention mode.
Overview
The Monitoring Configuration page is the central control panel for managing Database Activity Monitoring (DAM) across your data assets. From this page, you can view the monitoring status of every asset, add new assets to monitoring, modify storage policies that control which queries are retained, and enable Prevention mode for inline query blocking and data redaction.
This guide covers the full monitoring configuration workflow: understanding the dashboard summary, adding assets to monitoring (including variant flows for Snowflake and Azure), configuring storage policies, enabling Prevention mode, and handling common error cases.
Prerequisites
-
DAM is enabled for your Aurva account.
-
At least one data asset has been onboarded (see: Onboarding a Data Asset Manually guide).
-
You have an Admin or Security Operator role.
-
For Prevention mode: Proxy-based enforcement must be configured on the controller.
-
Available license capacity (shown in the Licenses widget on the monitoring page).
Navigation
Access the Monitoring Configuration page via either path:
| Settings › Monitoring Configuration |
|---|
Understanding the Monitoring Dashboard
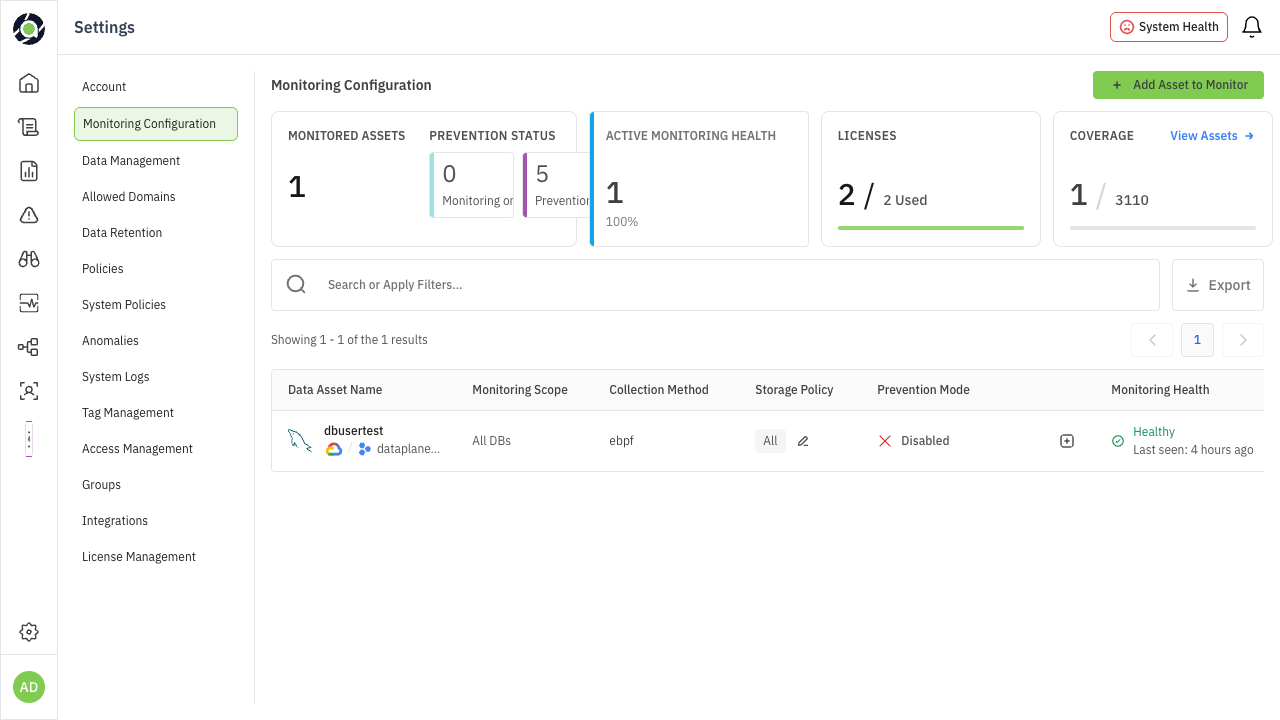
The top of the page displays five summary cards that give you an at-a-glance view of your monitoring posture:
| Card | What It Shows | What to Watch For |
|---|---|---|
| Monitored Assets | Total number of assets under active monitoring, with a sub-count of assets that are “Not Collecting” (i.e., configured but not receiving data). | If “Not Collecting” count is high, investigate — these assets have blind spots. |
| Prevention Status | Split between “Monitoring only” (passive observation) and “Prevention” (active blocking/redaction enabled). | If you have Guardrail policies but few assets in Prevention mode, those policies aren’t being enforced. |
| Active Monitoring Health | Ratio of healthy to total monitored assets, shown as a percentage (e.g., 21/24 = 83%). | Below 80% health means multiple assets have degraded or inactive monitoring. Prioritize fixing these. |
| Licenses | Licenses used vs. total allocated, with a warning when capacity is low (e.g., “Only 2 left”). | Running out of licenses blocks you from adding new assets. Plan capacity ahead of new deployments. |
| Coverage | Assets monitored vs. total assets in your environment. | Low coverage means you have unmonitored data assets — potential blind spots in your security posture. |
The Asset List
Below the summary cards is the full list of monitored assets. Each row represents a single data asset and displays its current configuration. Use the search bar and filters to find specific assets. Click Export to download the list.
| Column | Description | Editable |
|---|---|---|
| Data Asset Name | Asset name with cloud provider tags, environment labels, and controller association. | No |
| Monitoring Scope | Which databases are monitored — “All DBs” or a specific count (e.g., “6 DBs”). Click the edit icon to modify. | Yes |
| Collection Method | How Aurva collects query events: eBPF (kernel-level), Cloud Log Exporter, or On Prem Log Exporter. | Yes |
| Storage Policy | What query types are stored. | Yes |
| Prevention Mode | Whether inline blocking/redaction is active. Shows status (Configured/Enabling/Awaiting connection/Disabled/Not supported), port number, and enable date. | Yes |
| Monitoring Health | Current health status: Healthy (green), Degraded (orange), Not Collecting (red), or Inactive (gray). Shows last-seen timestamp and source status. | No |
| Action | Delete the monitoring configuration for this asset. | — |
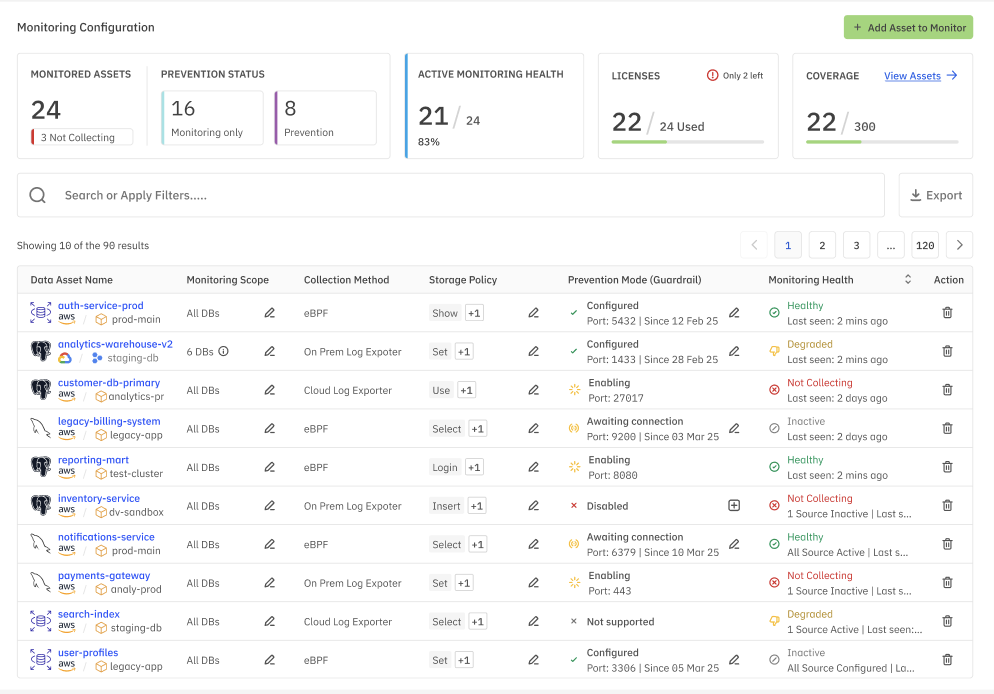
Figure 1: Monitoring Configuration — summary cards and asset list view
Tip — All columns with an edit icon (✎) can be modified inline. Click the icon to open the edit dialog for that specific field without navigating away from the list.
Adding an Asset to Monitoring
Click the + Add Asset to Monitor button in the top-right corner. The dialog that appears depends on the type of data asset you’re onboarding. Each variant consumes 1 license.
Standard Flow (Most Databases)
For most database types (PostgreSQL, MySQL, MongoDB, etc.), the Add Asset to Monitor dialog presents the following fields:
| Field | Description |
|---|---|
| Data Asset or Host Name | Select an existing data asset from the dropdown, or enter a hostname manually. |
| Collection Method | Choose how Aurva will collect query events. Options vary by deployment: eBPF (kernel-level packet capture, lowest latency) or Cloud Log Exporter (pulls from cloud-native audit logs). For on-premises deployments, Cloud Log Exporter is replaced by On Prem Log Exporter. |
| Database | Select which databases to monitor — “All Database” to monitor everything, or select specific databases for scoped monitoring. |
| Storage Policy | Controls which queries are stored for analysis. Three options: Store All Queries (captures everything), Scope by Operation Type (filter by DML, DDL, DCL, etc.), or Scope by Query Type (filter by SELECT, INSERT, UPDATE, etc.). The Include Unclassified Queries checkbox ensures queries that can’t be categorized are also stored. |
Click Submit to enable monitoring. The asset will appear in the list with its initial health status.
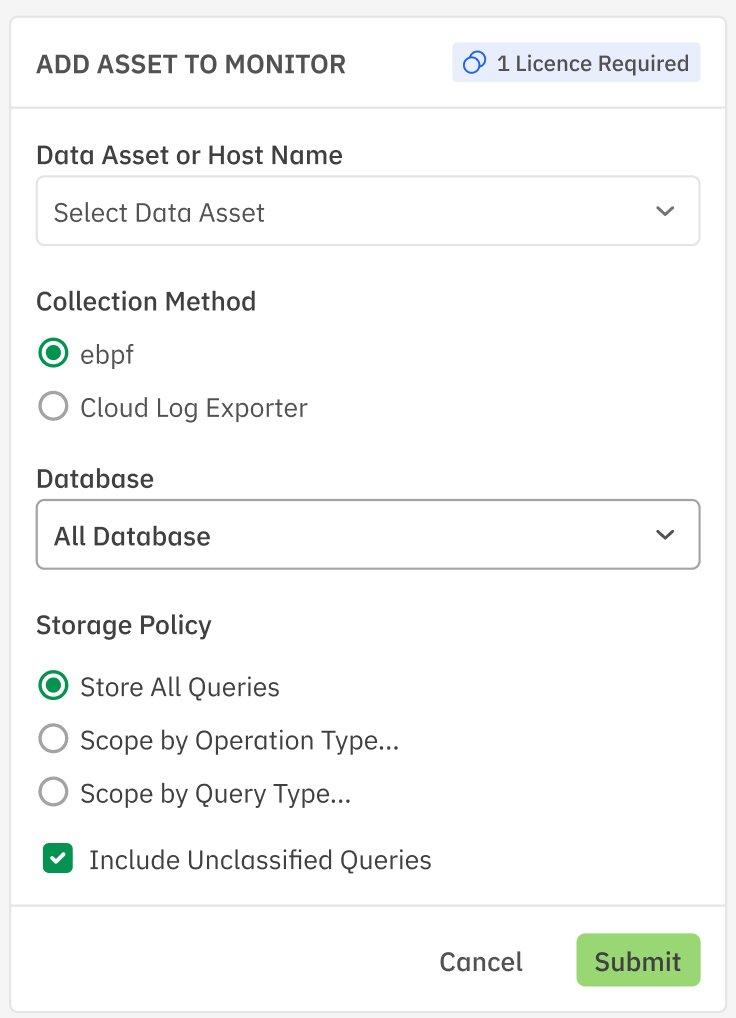
Figure 2: Add Asset to Monitor — standard flow with collection method and storage policy options
Snowflake Variant
When adding a Snowflake data asset, the dialog changes significantly. Snowflake uses audit log collection (not eBPF), and requires additional configuration for warehouse access and S3 staging.
| Field | Description |
|---|---|
| Data Asset | Enter the Snowflake data asset name. |
| Snowflake DB Name | The name of the Snowflake database to monitor. |
| Snowflake Warehouse | The warehouse used for executing monitoring queries against Snowflake’s query history. |
| S3 Bucket Name | The S3 bucket used for staging audit log exports. |
| S3 Bucket Region | The AWS region where the S3 bucket is located. |
| Setup S3 Stage (optional) | Toggle to configure an S3 stage directly. When enabled, additional AWS credential fields appear. |
| AWS Key ID | The AWS access key ID for S3 bucket access. |
| AWS Secret Key | The AWS secret access key for S3 bucket access. |
| AWS KMS Key ID | The KMS key ID used for encrypting data at rest in the S3 bucket. |
Figure 3: Add Asset to Monitor — Snowflake variant with S3 staging configuration
Note — For Snowflake, the collection method is always Audit Logs. eBPF is not available because Snowflake is a fully managed SaaS platform with no kernel-level access.
Azure Variant
When adding an Azure-hosted data asset (e.g., Azure SQL, Cosmos DB), the standard flow is shown with one additional field: Database User. This field lets you specify which database user(s) to monitor, allowing you to scope monitoring to specific application or service accounts rather than capturing all user activity.
Enabling Prevention Mode
Prevention mode enables inline query interception — allowing Aurva to actively block risky queries or redact sensitive data in real time (as defined by your Guardrail policies). To enable Prevention mode on an asset, click the (+) icon in the Prevention Mode column for that asset.
Configuration Fields
| Field | Description |
|---|---|
| Port No. | The proxy port that Aurva will use for intercepting database connections. This must be a port not already in use and not in a reserved range. |
| User Name Delimiter | The delimiter used to parse compound usernames in database connections (e.g., separating application name from actual username). Select from the dropdown. |
Post-Enable Steps
After you click Enable, the dialog shows the required next steps for your infrastructure team:
-
Step 1 — Update connection string: Change the application’s database connection to point to the new proxy port. The dialog shows the exact old and new connection strings (e.g., postgres-prod-01:5432 becomes postgres-prod-01:5433).
-
Step 2 — Restart application: Restart the application associated with the data asset so it picks up the new connection string.
Important — Aurva will verify the connection once the application sends its first query through the proxy port. Until then, the Prevention Mode status will show “Awaiting connection”. This is expected behavior.
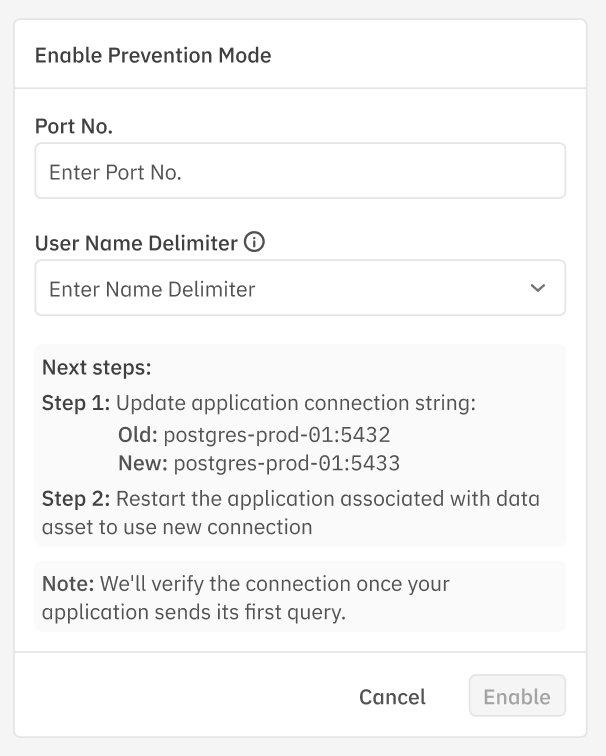
Figure 4: Enable Prevention Mode — port configuration and post-enable connection update steps
Port Validation Errors
When entering a port number for Prevention mode, the system validates it in real time. If the port is invalid, you’ll see one of the following error messages:
| Error | Cause | Resolution |
|---|---|---|
| Port Already in Use | Another service or data asset is already using this port on the same host. | Choose a different port. Check existing Prevention mode configurations for port conflicts. |
| Port in Reserved Range | The port falls within a reserved system range (typically 0–1023). | Use a port above 1024. Common choices: 5433, 3307, 27018 (offset from default DB ports). |
| Port Out of Valid Range | The port number exceeds the valid TCP port range (1–65535). | Enter a port number between 1024 and 65535. |
| Port Same as Database Port | The entered port matches the database’s own listening port. | The proxy port must be different from the database port. Use an adjacent port (e.g., if DB is on 5432, use 5433). |
Understanding Monitoring Health
The Monitoring Health column shows the real-time status of data collection for each asset. Understanding these states helps you quickly identify and resolve monitoring gaps.
| Status | Indicator | What It Means | Action Required |
|---|---|---|---|
| Healthy | Green | Query data is actively being collected. Last-seen timestamp is recent (within minutes). | None — monitoring is working as expected. |
| Degraded | Orange | Data collection is partially working but experiencing issues (e.g., intermittent connectivity, delayed log delivery). | Check source connectivity. Review controller logs for errors. May resolve automatically. |
| Not Collecting | Red | No query data is being received despite monitoring being configured. Sources may be inactive. | Investigate immediately. Verify the data source is reachable, credentials are valid, and the collection method is operational. |
| Inactive | Gray | Monitoring was previously configured but the asset has not sent data in an extended period. | Verify the asset is still operational. If decommissioned, remove the monitoring configuration to free the license. |
Understanding Prevention Mode States
The Prevention Mode column shows the current proxy enforcement status for each asset:
| Status | Description |
|---|---|
| Configured | Prevention mode is fully active. The proxy is intercepting queries on the listed port. Shows the port number and the date since which it’s been enabled. |
| Enabling | Prevention mode setup is in progress. The proxy is being initialized on the specified port. This is a transitional state. |
| Awaiting connection | The proxy is ready but no application has connected through it yet. Waiting for the first query through the proxy port. |
| Disabled | Prevention mode has been explicitly turned off for this asset. Guardrail policies will not be enforced. |
| Not supported | The data asset type or collection method does not support Prevention mode (e.g., some Cloud Log Exporter configurations). |
Storage Policy Reference
Storage policies control which queries are retained for analysis, audit, and alerting. Choosing the right policy balances visibility with storage cost and noise reduction.
| Policy Option | What Gets Stored | Best For |
|---|---|---|
| Store All Queries | Every query executed against the database, regardless of type or sensitivity. | High-security environments, compliance audits, initial monitoring setup when you need full visibility. |
| Scope by Operation Type | Only queries matching selected operation types (DML, DDL, DCL, etc.). | Environments where you want to focus on write operations or schema changes without capturing read-heavy analytics. |
| Scope by Query Type | Only queries matching selected types (SELECT, INSERT, UPDATE, DELETE, etc.). | Fine-grained control when you know exactly which query patterns matter for your policies. |
Tip — Start with “Store All Queries” during initial onboarding to establish a baseline of normal activity. After 2–4 weeks, review query patterns and narrow to a scoped policy to reduce storage costs. Always keep “Include Unclassified Queries” checked — unclassified queries may contain novel attack patterns.
Quick Reference
| Task | How To | Key Consideration |
|---|---|---|
| Add asset to monitoring | Click + Add Asset to Monitor, select asset and collection method, configure storage policy | 1 license consumed per asset |
| Add Snowflake asset | Same button, but provide Snowflake DB, warehouse, and S3 staging details | Audit log collection only |
| Add Azure asset | Same as standard flow + Database User field | Scope to specific users if needed |
| Enable Prevention mode | Click (+) in Prevention Mode column, enter port and delimiter | Update app connection strings after enabling |
| Modify storage policy | Click edit icon in Storage Policy column | Narrowing policy reduces storage but may miss events |
| Check monitoring health | Review Monitoring Health column for status colors | Red/Orange = investigate immediately |
| Handle port errors | Try adjacent port numbers, avoid reserved range (0–1023) | Don’t reuse existing ports or DB port |