Overview Dashboard
Understand your data security posture at a glance.
Overview
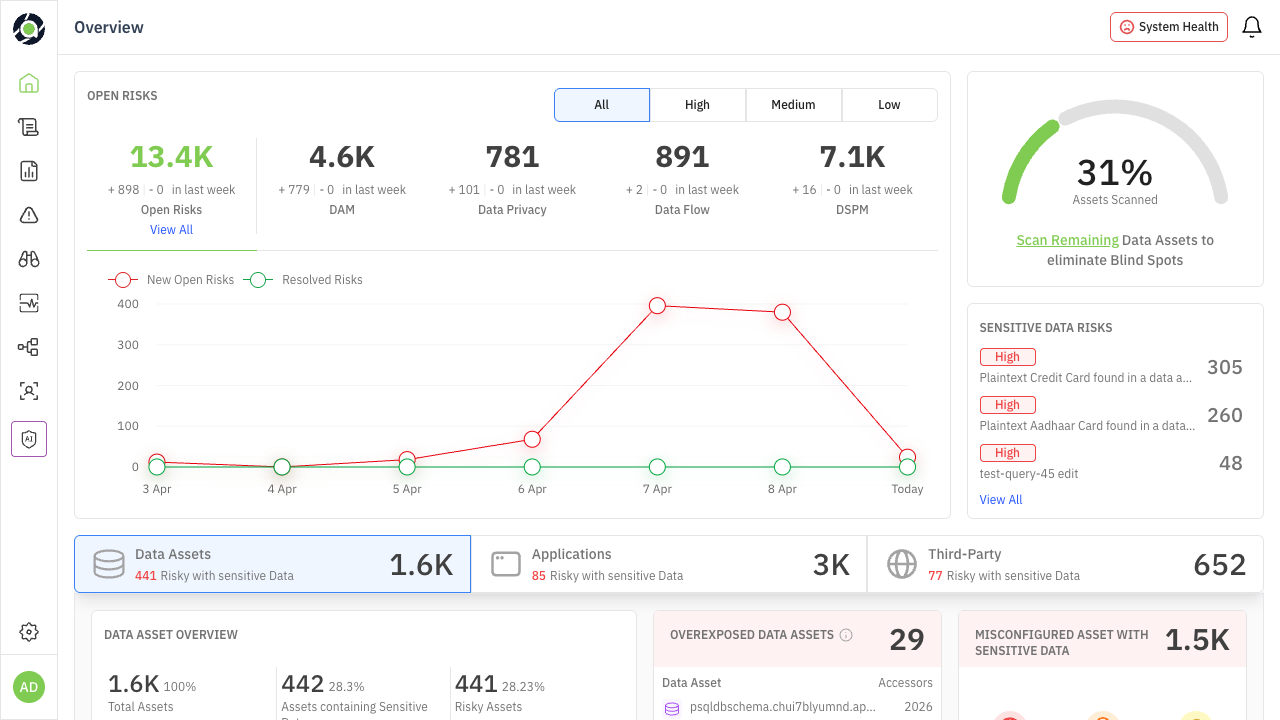
The Overview Dashboard is the first screen you see when you log into Aurva. It provides a single-pane view of your organization’s data security posture — surfacing risks, sensitive data exposure, compliance gaps, and misconfiguration issues across all your monitored data assets, applications, and third-party connections.
This guide explains every section of the dashboard, what the numbers mean, and — most importantly — what actions you should take based on what you see. Throughout this guide, look for the color-coded persona callouts:
| 🎯 For CISOs & Leadership Strategic questions to ask, metrics to track for board reporting, and signals that require escalation. | 🔧 For Security Operators Specific actions to take, investigations to prioritize, and workflows to execute based on dashboard signals. |
|---|
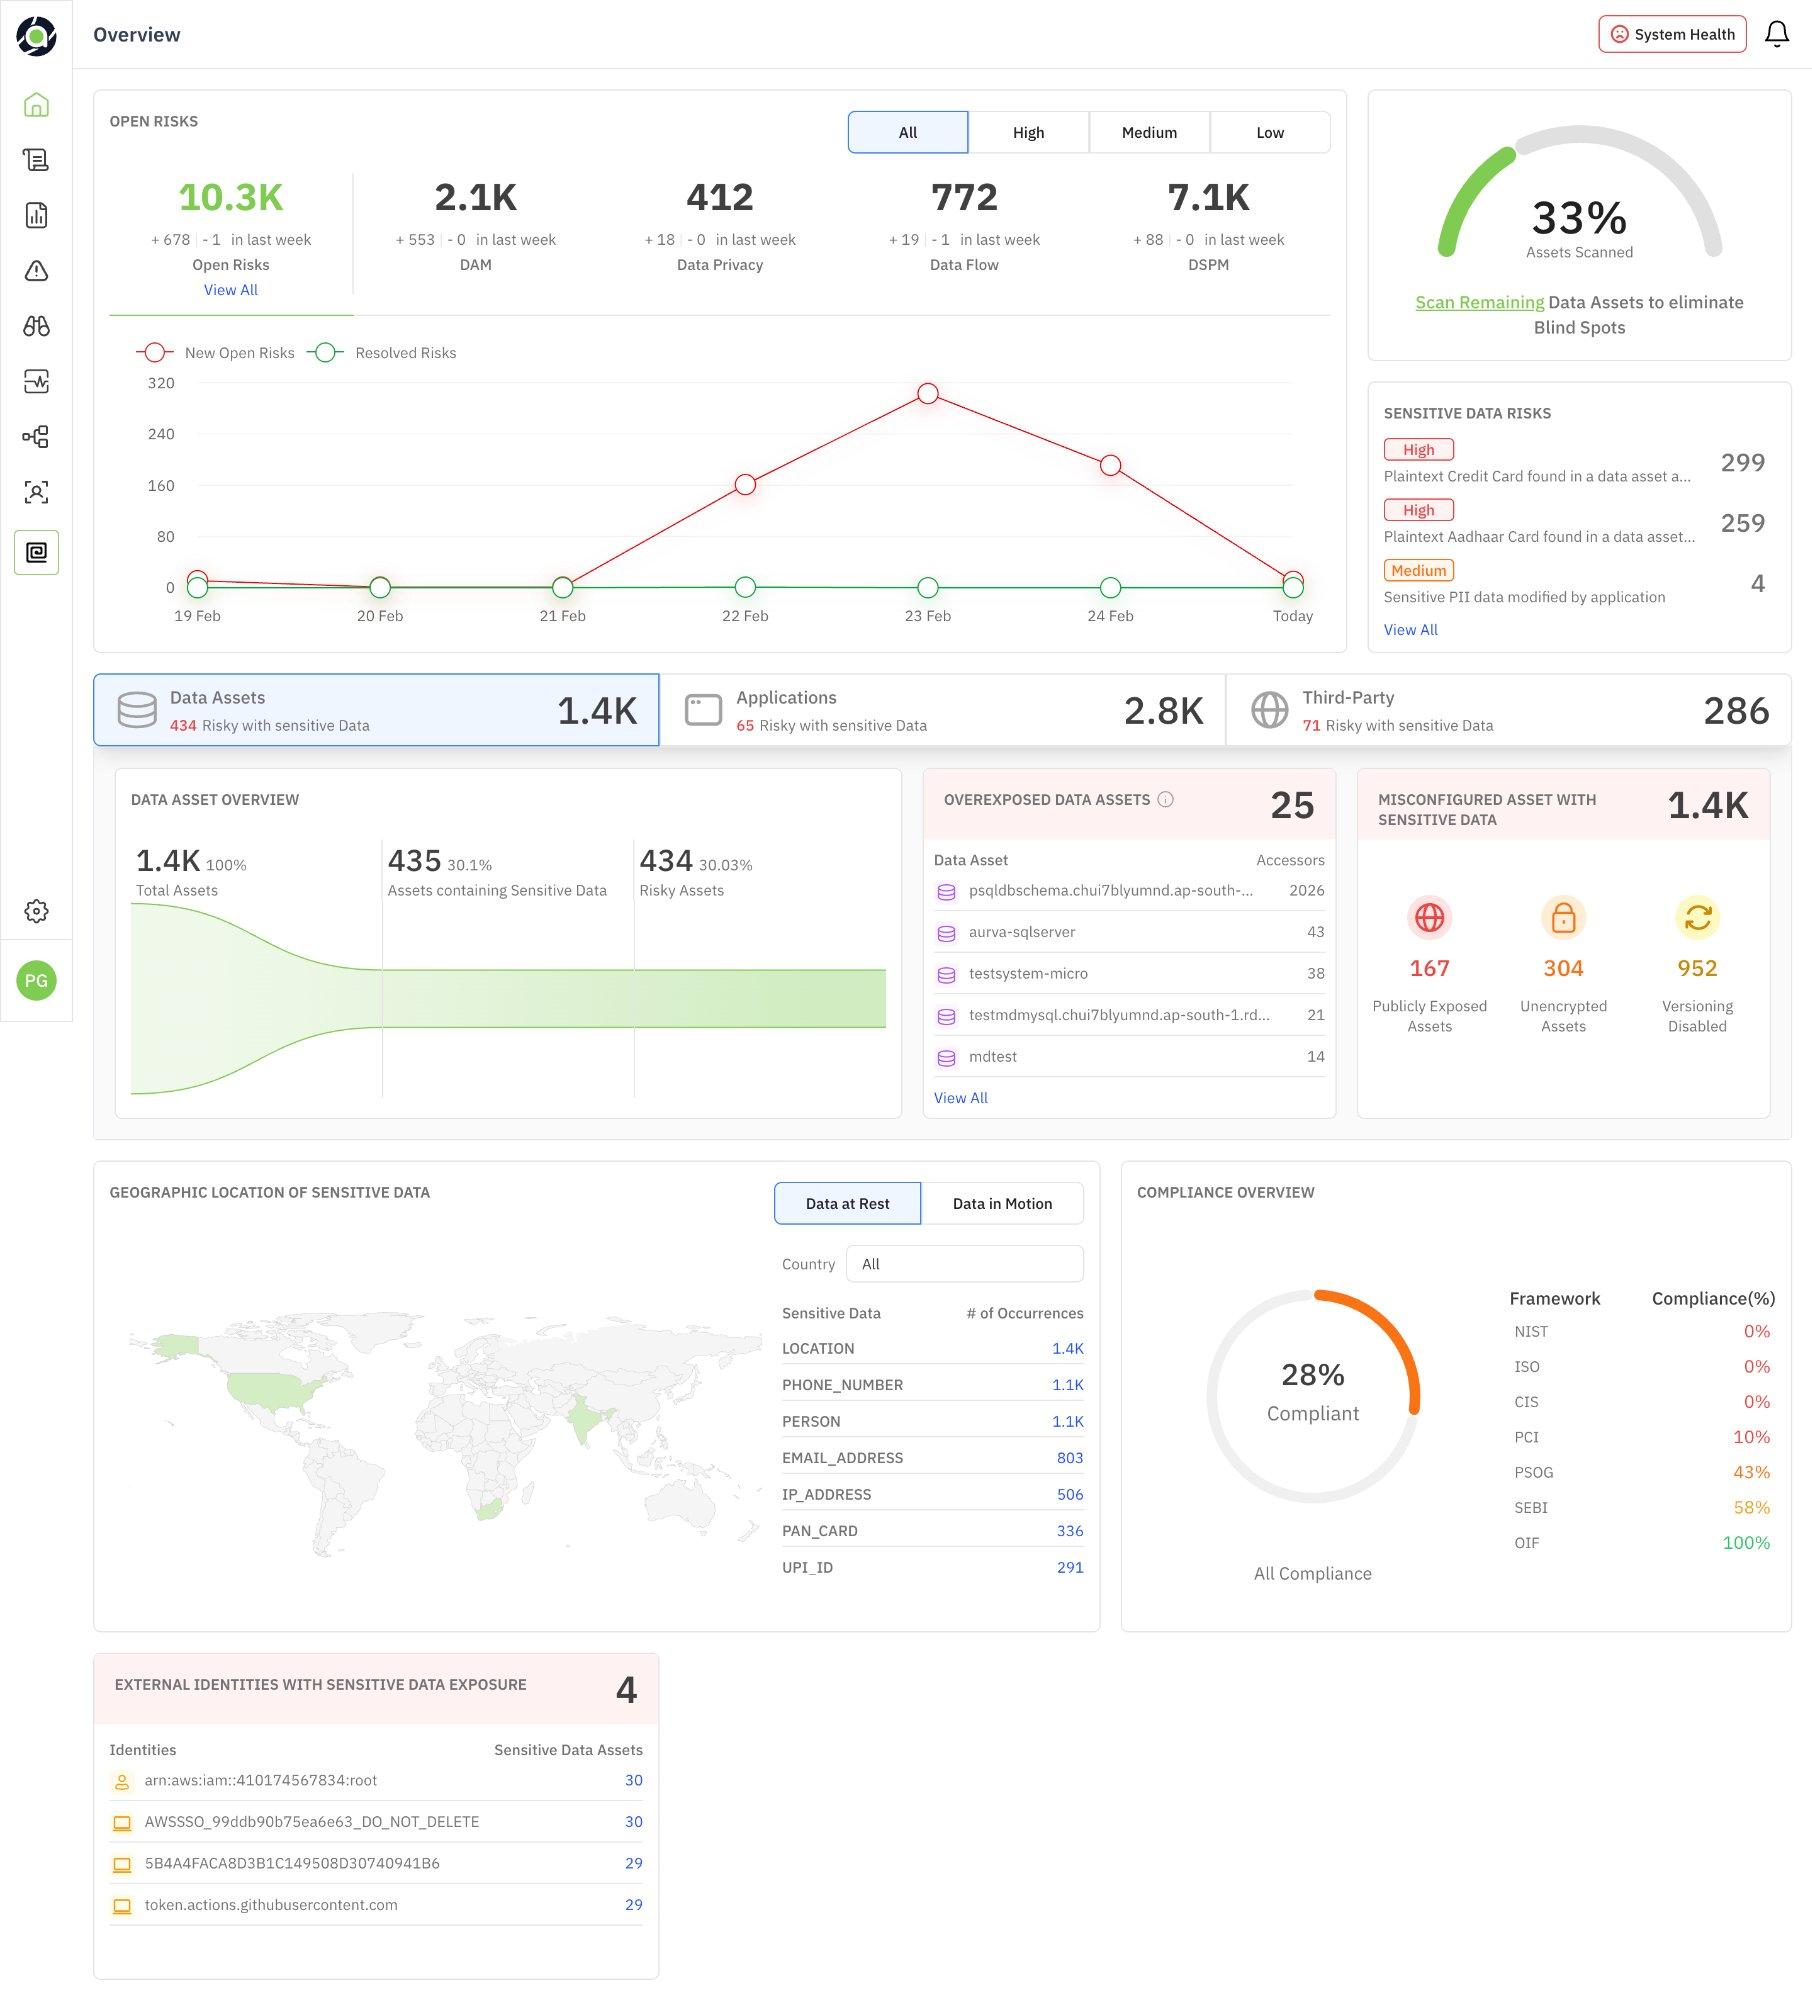
Figure 1: Overview Dashboard — full view showing all data security posture sections
Open Risks Summary
The top-left section of the dashboard displays a high-level breakdown of all open risks across your environment. Risks are categorized by domain and can be filtered by severity.
| Metric | What It Tells You |
|---|---|
| Open Risks (Total) | The aggregate count of all unresolved risks across every domain. A rising number signals growing exposure; a declining number indicates effective remediation. |
| DAM | Risks from database activity monitoring — suspicious queries, privilege abuse, unauthorized access attempts. |
| Data Privacy | Risks related to PII exposure, consent violations, or regulatory non-compliance. |
| Data Flow | Risks from data movement — unexpected egress, cross-environment transfers, insecure transmission paths. |
| DSPM | Risks related to data security posture — misconfigurations, overexposure, unencrypted assets, stale permissions. |
| Severity Filters | Toggle between All, High, Medium, and Low to focus on the risks that need immediate attention vs. long-term cleanup. |
The week-over-week delta shown beneath each number (e.g., “+678 / -1 in last week”) tells you whether risks are trending up or down. Pay attention to the ratio of new risks to resolved risks — if new risks consistently outpace resolutions, your team is falling behind.
| 🎯 For CISOs & Leadership Track the total Open Risks number weekly for board reporting. If the number grows 3 weeks in a row, escalate for additional security resourcing. Use severity filters to report “X High-severity risks remain open” in executive summaries. | 🔧 For Security Operators Start your day by filtering to High severity. Click “View All” to drill into the risk list. Prioritize DAM risks (active threats) over DSPM risks (posture gaps) for immediate investigation. |
|---|
Risk Trend Chart
The trend chart below the risk summary plots New Open Risks (red) against Resolved Risks (green) over the past week. Hover over any data point to see the exact numbers for that day.
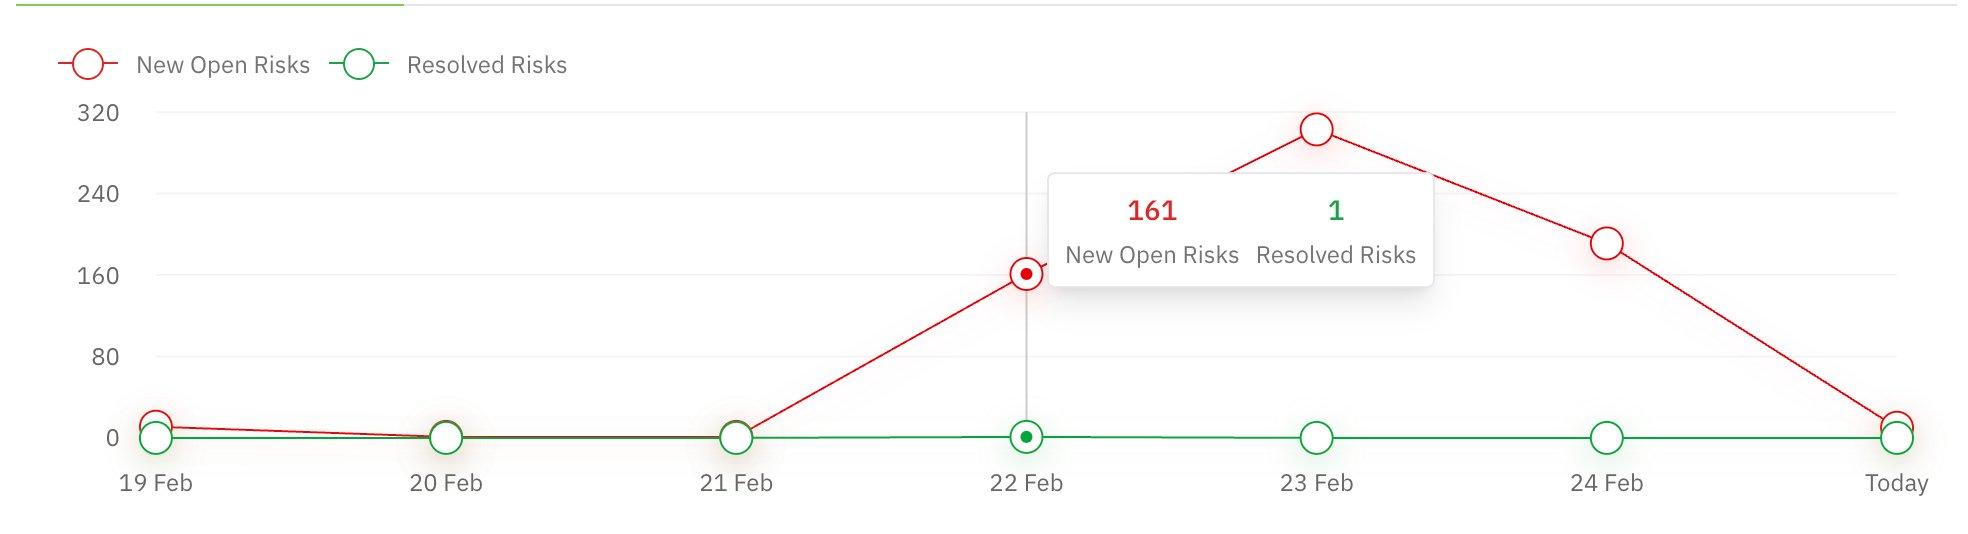
Figure 2: Risk Trend chart — New Open Risks vs. Resolved Risks over time
How to read this chart:
-
Red line trending up: New risks are being discovered faster than they’re being resolved. Could indicate a new scan uncovering issues, a configuration change, or an active threat.
-
Green line above red: Your team is resolving risks faster than they appear — this is the ideal state.
-
Sharp spikes: A sudden spike in new risks (e.g., 161 in a single day) typically means a new data asset was scanned or a major misconfiguration was detected. Investigate the cause rather than just the count.
-
Flat green line near zero: Risks are accumulating without resolution. This is a process problem, not a detection problem.
| 🎯 For CISOs & Leadership Use this chart in weekly security reviews. A persistent gap between red and green lines means your team needs either more capacity or better prioritization. Ask: “What caused the spike on [date]?” and “What’s our average time-to-resolve?” | 🔧 For Security Operators When you see a spike, click into that day’s risks to identify the root cause. Was it a new scan? A policy change? A misconfiguration deployment? Correlate spikes with your change management timeline. |
|---|
Scan Coverage & Sensitive Data Risks
The top-right corner shows two critical widgets:
Assets Scanned
A circular progress indicator showing the percentage of data assets that have been scanned (e.g., 33%). The Scan Remaining link lets you trigger scans for unscanned assets to eliminate blind spots in your security posture.
Sensitive Data Risks
Lists the most critical risks related to sensitive data discovery, sorted by severity. These typically include findings like plaintext credit card numbers, Aadhaar card data, or PII being modified by applications. The count next to each risk shows how many instances were found.
| 🎯 For CISOs & Leadership The “Assets Scanned” percentage is your coverage metric. Anything below 80% means you have significant blind spots. Report this number alongside your risk counts — “We have X risks across Y% of scanned assets” gives a much more honest picture than risk counts alone. | 🔧 For Security Operators If scan coverage is low, click “Scan Remaining” immediately. Unscanned assets are unknown risks. For Sensitive Data Risks, prioritize plaintext credit card and PII findings — these often have regulatory deadlines. |
|---|
Asset Inventory Tabs
The middle section of the dashboard provides three switchable views into your monitored environment. Each tab focuses on a different entity type and surfaces the most relevant risk metrics for that entity.
Data Assets Tab
Shows all monitored databases and data stores. The key metrics here are:
| Widget | What It Shows | Why It Matters |
|---|---|---|
| Data Asset Overview | Total assets, assets containing sensitive data, and risky assets with trend visualization. | Tells you what percentage of your data estate holds sensitive data and how much of it is at risk. |
| Overexposed Data Assets | Assets with the most external accessors, ranked by accessor count. | An asset with 2,000+ accessors is likely overshared. Investigate whether all those identities genuinely need access. |
| Misconfigured Assets | Breakdown of publicly exposed, unencrypted, and versioning-disabled assets. | These are posture issues with known fixes. Publicly exposed assets are the highest priority. |
| 🎯 For CISOs & Leadership Track the ratio of “Risky Assets” to “Total Assets” over time. If 30%+ of your assets are risky, this signals a systemic posture problem, not isolated incidents. Use the Misconfigured Assets numbers for compliance reporting. | 🔧 For Security Operators Start with Overexposed Data Assets — click into each to review the accessor list and revoke unnecessary permissions. For Misconfigured Assets, create tickets for the top publicly exposed and unencrypted assets. |
|---|
Applications Tab
Switches the view to application-level insights — which applications are connecting to your databases, how many have access to sensitive data, and which pose the highest risk.
Figure 3: Applications tab — application overview, over-privileged applications, and insecure port usage
| Widget | What It Shows | Why It Matters |
|---|---|---|
| Application Overview | Total applications, those with sensitive data access, risky applications, and those sending data to third parties. | Reveals shadow access — applications you may not know are touching sensitive data. |
| Over Privileged Applications | Applications with more data asset access than they likely need, ranked by asset count. | Over-privileged apps are breach amplifiers. A compromised app with access to 30 assets is far more dangerous than one with access to 3. |
| Insecure Ports | Applications transferring data over insecure ports (e.g., port 80, 53, 22). | Data transmitted on port 80 (HTTP) or port 53 (DNS) is unencrypted and potentially interceptable. |
| 🎯 For CISOs & Leadership Ask your team: “Do we have a policy requiring applications to use encrypted ports only?” If applications are using port 80, that’s a policy gap. The “Sending Data to Third-Party” metric is critical for data processing agreements and vendor risk reporting. | 🔧 For Security Operators Investigate over-privileged applications immediately — especially any with 10+ data asset connections. For insecure ports, work with infrastructure teams to enforce TLS. Port 80 traffic carrying sensitive data is a critical finding. |
|---|
Third-Party Tab
Shows external domains and services that are accessing or receiving data from your environment. This is your vendor risk and data egress view.
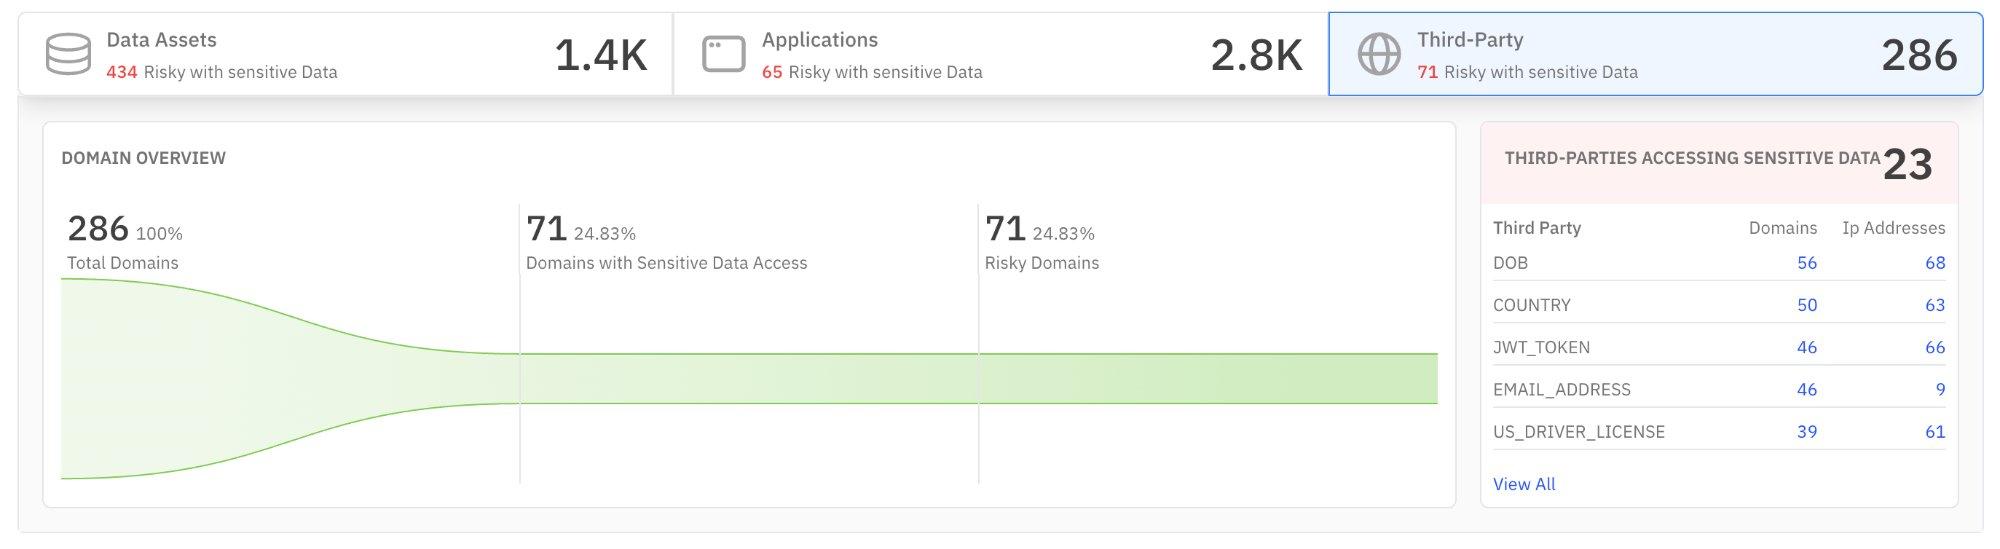
Figure 4: Third-Party tab — domain overview and third parties accessing sensitive data
| Widget | What It Shows | Why It Matters |
|---|---|---|
| Domain Overview | Total external domains, those accessing sensitive data, and risky domains with trend data. | If nearly 25% of external domains have sensitive data access, your data boundary may be too porous. |
| Third-Parties Accessing Sensitive Data | Ranked list of external domains by the type of sensitive data they access (DOB, country, JWT tokens, email, driver’s license). | Reveals exactly what sensitive data types are leaving your environment and to whom. Critical for GDPR, DPDPA, and cross-border compliance. |
| 🎯 For CISOs & Leadership This tab directly feeds your vendor risk assessment and data processing impact reports. If a third-party domain is accessing DOB + email + driver’s license data, that’s PII aggregation risk. Verify that each third party has an appropriate data processing agreement in place. | 🔧 For Security Operators Cross-reference the top third-party domains against your approved vendor list. Any domain not on the approved list accessing sensitive data is a potential data leak. Escalate unknown domains immediately. |
|---|
Geographic Location & Compliance
Geographic Location of Sensitive Data
This section shows where your sensitive data physically resides (Data at Rest) and where it’s being transmitted to (Data in Motion). Toggle between the two views. The map visualizes geographic distribution, while the table on the right ranks sensitive data types by occurrence count.
Data at Rest
Shows where sensitive data is stored. The ranked list reveals which types of sensitive data are most prevalent — Location, Phone Number, Person (names), Email Address, IP Address, PAN Card, and UPI ID in the example shown. This is your sensitive data inventory.
Data in Motion
Shows active cross-border data transfers with flow lines on the map. The table lists destination domains and their transfer counts. Red flag icons indicate domains where data is being sent to countries with different data protection regimes.
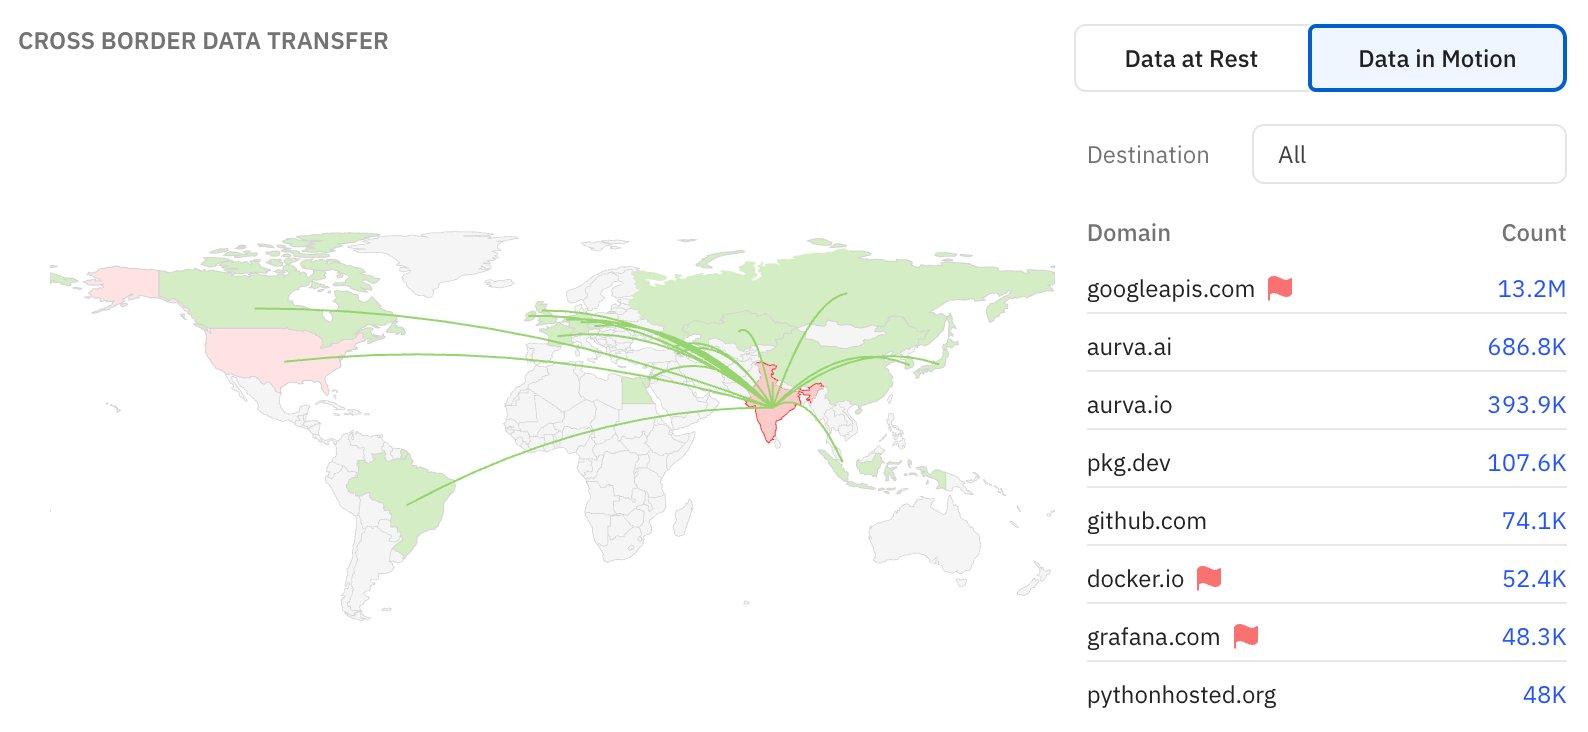
Figure 5: Cross Border Data Transfer — Data in Motion view showing destination domains and transfer volumes
| 🎯 For CISOs & Leadership This is your data residency and cross-border compliance view. If sensitive data is flowing to jurisdictions without adequacy agreements (flagged in red), you may have a regulatory obligation to document or restrict this. Use this section for DPDPA/GDPR reporting and board-level data sovereignty discussions. | 🔧 For Security Operators Focus on flagged domains (red flags). For each, verify: Is this transfer authorized? Is there encryption in transit? Is there a legitimate business need? Work with compliance to document any cross-border flows that require legal basis. |
|---|
Compliance Overview
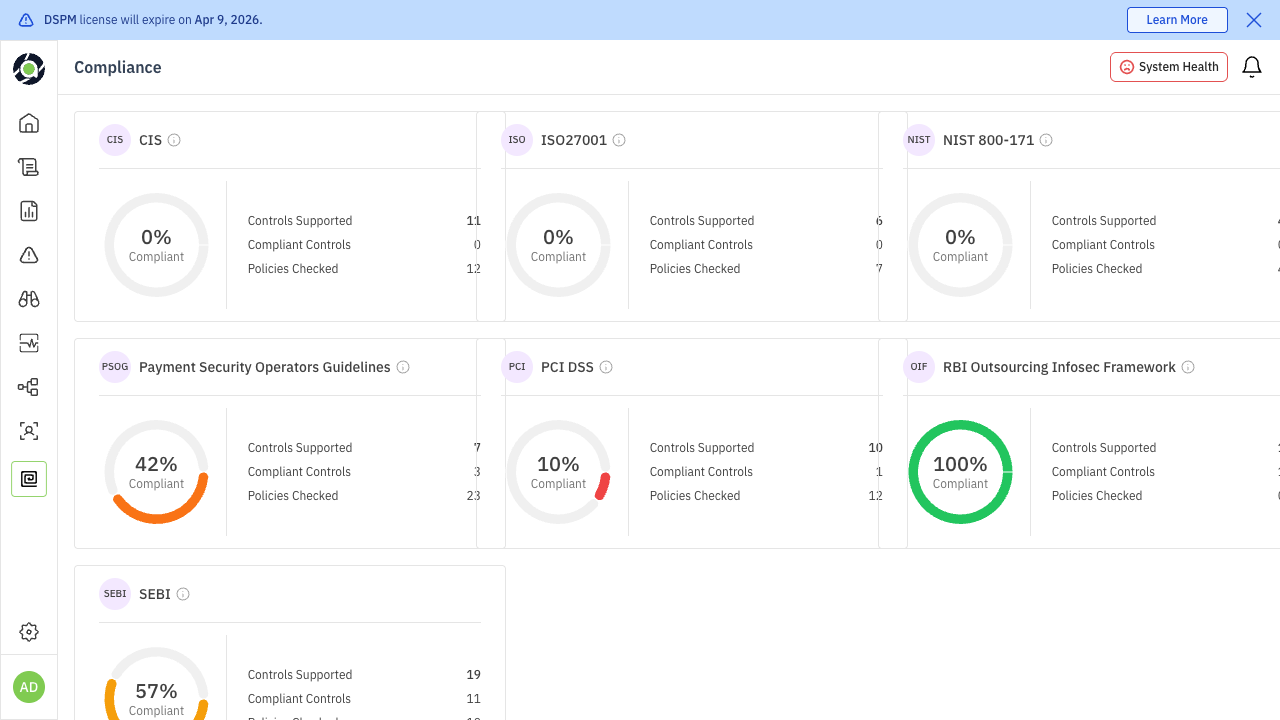
The compliance widget shows your overall compliance percentage and breaks it down by framework. In the example shown, frameworks include NIST, ISO, CIS, PCI, PSOG, SEBI, and OIF, each with their individual compliance score.
| Reading | What It Means | Recommended Action |
|---|---|---|
| 0% on a framework | No controls mapped or no policies active for that framework. | If the framework is relevant to your business, this is a critical gap. Start by mapping existing policies to framework controls. |
| 10–50% | Partial coverage — some controls addressed but significant gaps remain. | Review the framework requirements and identify which controls need new policies or configurations. |
| 50–80% | Good progress. Focus on closing remaining gaps. | Prioritize the highest-impact missing controls. |
| 80–100% | Strong compliance posture. | Maintain through regular audits and policy reviews. |
| 🎯 For CISOs & Leadership Use the overall compliance percentage (e.g., 28%) as a KPI in board reporting. Set quarterly targets for improvement. For audit preparation, click “All Compliance” to get detailed framework-level breakdowns. If a specific framework (e.g., PCI at 10%) is low and your business requires it, this is an immediate priority. | 🔧 For Security Operators Click into each framework to see which specific controls are failing. Map failing controls to Aurva policies — many compliance gaps can be closed by enabling and configuring existing policies rather than building new ones. |
|---|
External Identities with Sensitive Data Exposure
The bottom section highlights external identities (IAM roles, service accounts, third-party tokens) that have access to sensitive data assets. Each identity is listed with the count of sensitive data assets it can reach.
Why this matters:
-
High accessor counts: An external IAM root account with access to 30 sensitive data assets represents extreme blast radius if compromised.
-
Service accounts and tokens: GitHub action tokens or generic service accounts with broad sensitive data access are common attack vectors. These are often created once and never reviewed.
-
Non-human identities: Automated systems don’t respond to phishing, but their credentials can be leaked through code repositories, CI/CD logs, or misconfigured secrets management.
| 🎯 For CISOs & Leadership This is your external attack surface metric. If any single external identity has access to 20+ sensitive data assets, that’s a concentration risk. Ask: “Do we have a process for regularly reviewing and rotating external access credentials?” | 🔧 For Security Operators Review each external identity listed. For IAM root accounts, verify the account owner and whether root access is necessary (it almost never is). For service accounts and tokens, check if they follow the principle of least privilege and have recent rotation dates. |
|---|
Recommended Dashboard Workflows
The dashboard is most valuable when used as part of a consistent routine. Here are recommended workflows for each persona:
Daily Triage (Security Operators)
-
1. Check Open Risks: Filter to High severity. Are there new High risks since yesterday?
-
2. Review Risk Trend: Is today’s new risk count higher than your 7-day average? Investigate spikes.
-
3. Scan Coverage: If below 80%, trigger scans for remaining assets.
-
4. Overexposed Assets: Check if any new assets appeared in the overexposed list.
-
5. External Identities: Verify no new external identities have appeared with sensitive data access.
Weekly Review (CISOs & Leadership)
-
1. Open Risks trend: Are total open risks going up or down week-over-week?
-
2. Compliance progress: Have any framework scores improved? Are any declining?
-
3. Third-party exposure: Are new domains appearing in the third-party tab accessing sensitive data?
-
4. Cross-border flows: Any new flagged data transfers to review?
-
5. Misconfigured assets: Is the publicly exposed count decreasing? This measures your team’s remediation velocity.
Quick Reference: Dashboard Sections
| Section | Primary Question It Answers | Key Action |
|---|---|---|
| Open Risks | How many unresolved risks do we have? | Filter by severity, track weekly delta |
| Risk Trend | Are we getting better or worse? | Investigate spikes, monitor resolution rate |
| Scan Coverage | Do we have visibility gaps? | Scan remaining assets |
| Sensitive Data Risks | What’s our most critical exposure? | Prioritize plaintext PII findings |
| Data Assets | Which databases are most at risk? | Review overexposed and misconfigured assets |
| Applications | Which apps touch sensitive data? | Audit over-privileged apps, enforce TLS |
| Third-Party | Who outside our org has data access? | Verify vendor agreements, flag unknowns |
| Geographic Location | Where does our sensitive data live and flow? | Audit cross-border transfers |
| Compliance | How close are we to framework compliance? | Close gaps in priority frameworks |
| External Identities | What’s our external attack surface? | Review and rotate credentials |